Reports Overview
Understanding Reports in TradeReview
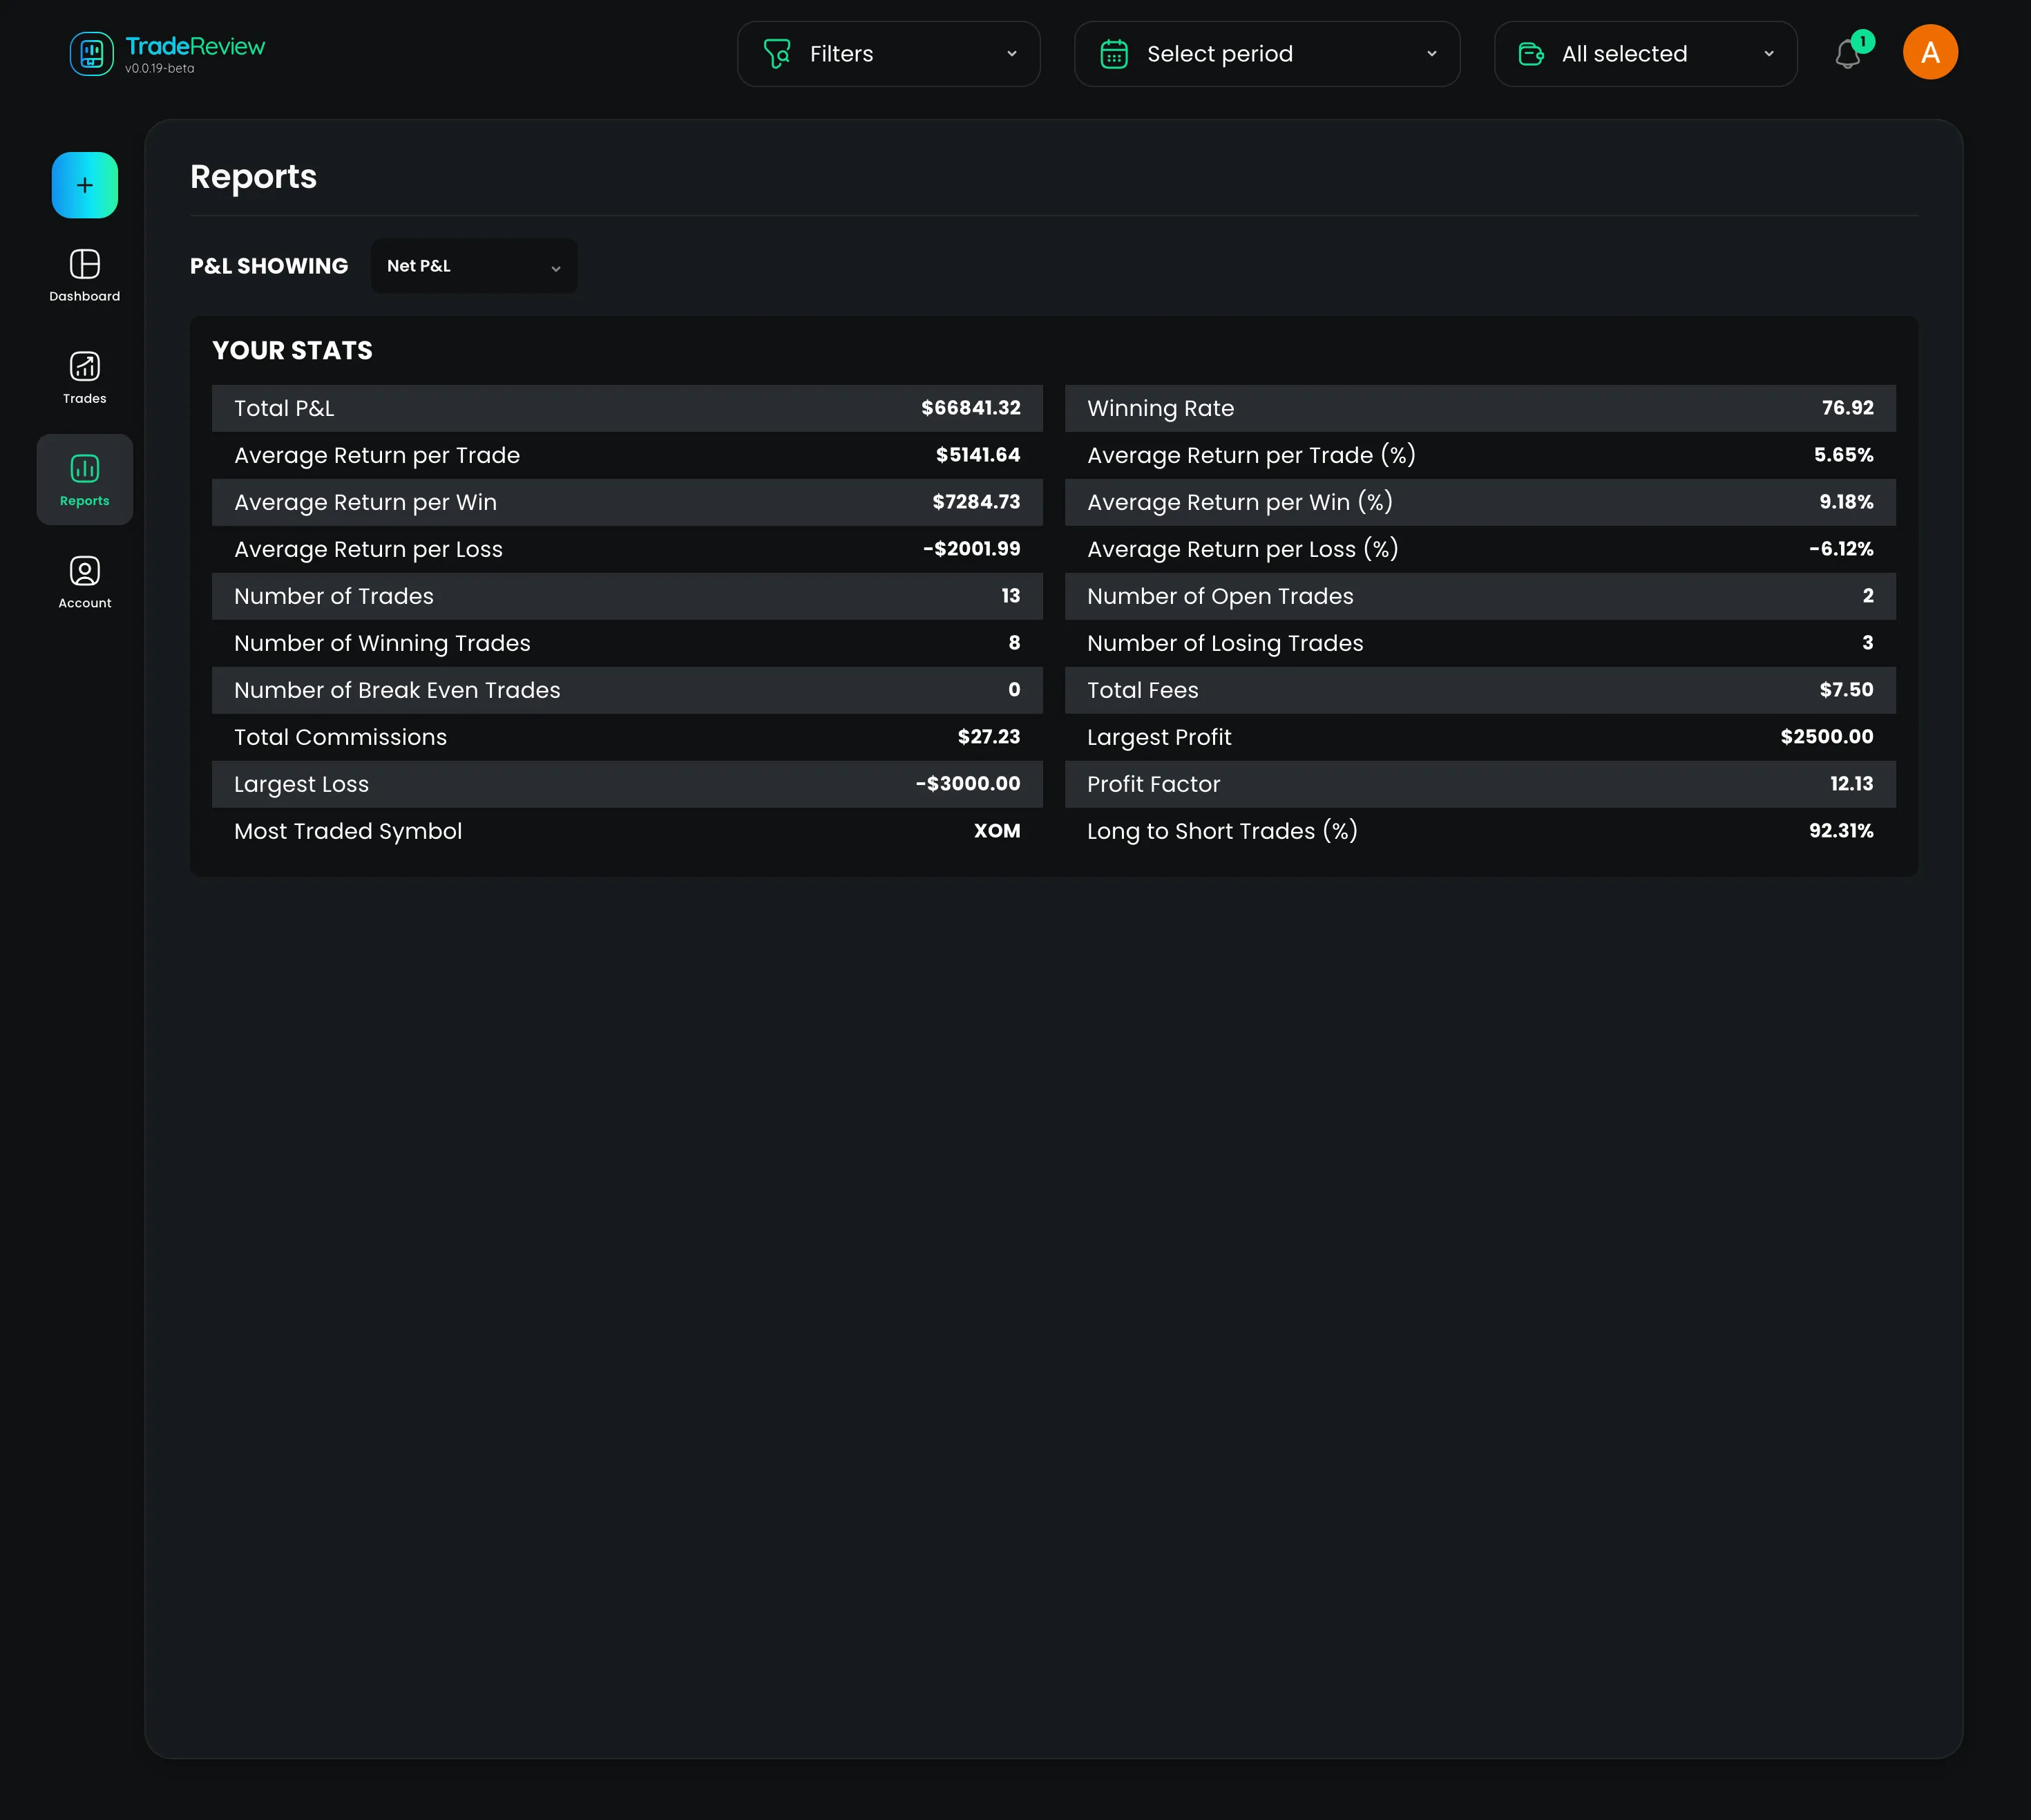
Section titled “Understanding Reports in TradeReview”TradeReview provides a comprehensive set of reports to help traders analyze their performance and make data-driven decisions. These reports offer insights into profitability, trade efficiency, and risk management.
Key Metrics in Reports
Section titled “Key Metrics in Reports”1. Profit & Loss Metrics
Section titled “1. Profit & Loss Metrics”- Total P&L – Overall profit or loss from all trades.
- Largest Profit – The highest profit made from a single trade.
- Largest Loss – The biggest loss incurred in a single trade.
- Profit Factor – The ratio of total profit to total loss.
2. Performance Metrics
Section titled “2. Performance Metrics”- Winning Rate – Percentage of trades that ended in profit.
- Average Return per Trade – The mean profit or loss per trade.
- Average Return per Trade (%) – The average return percentage per trade.
- Average Return per Win – Mean profit from winning trades.
- Average Return per Win (%) – The average percentage gain per winning trade.
- Average Return per Loss – Mean loss from losing trades.
- Average Return per Loss (%) – The average percentage loss per losing trade.
3. Trade Count & Distribution
Section titled “3. Trade Count & Distribution”- Number of Trades – Total number of executed trades.
- Number of Open Trades – Trades that are still active.
- Number of Winning Trades – Trades that resulted in a profit.
- Number of Losing Trades – Trades that resulted in a loss.
- Number of Break Even Trades – Trades that ended with no net gain or loss.
- Long to Short Trades (%) – Percentage of long vs. short trades executed.
- Most Traded Symbol – The asset that has been traded the most.
4. Cost Analysis
Section titled “4. Cost Analysis”- Total Fees – The total amount spent on trading fees.
- Total Commissions – The total commissions paid to brokers.