Understanding Dashboard
Overview of the Dashboard
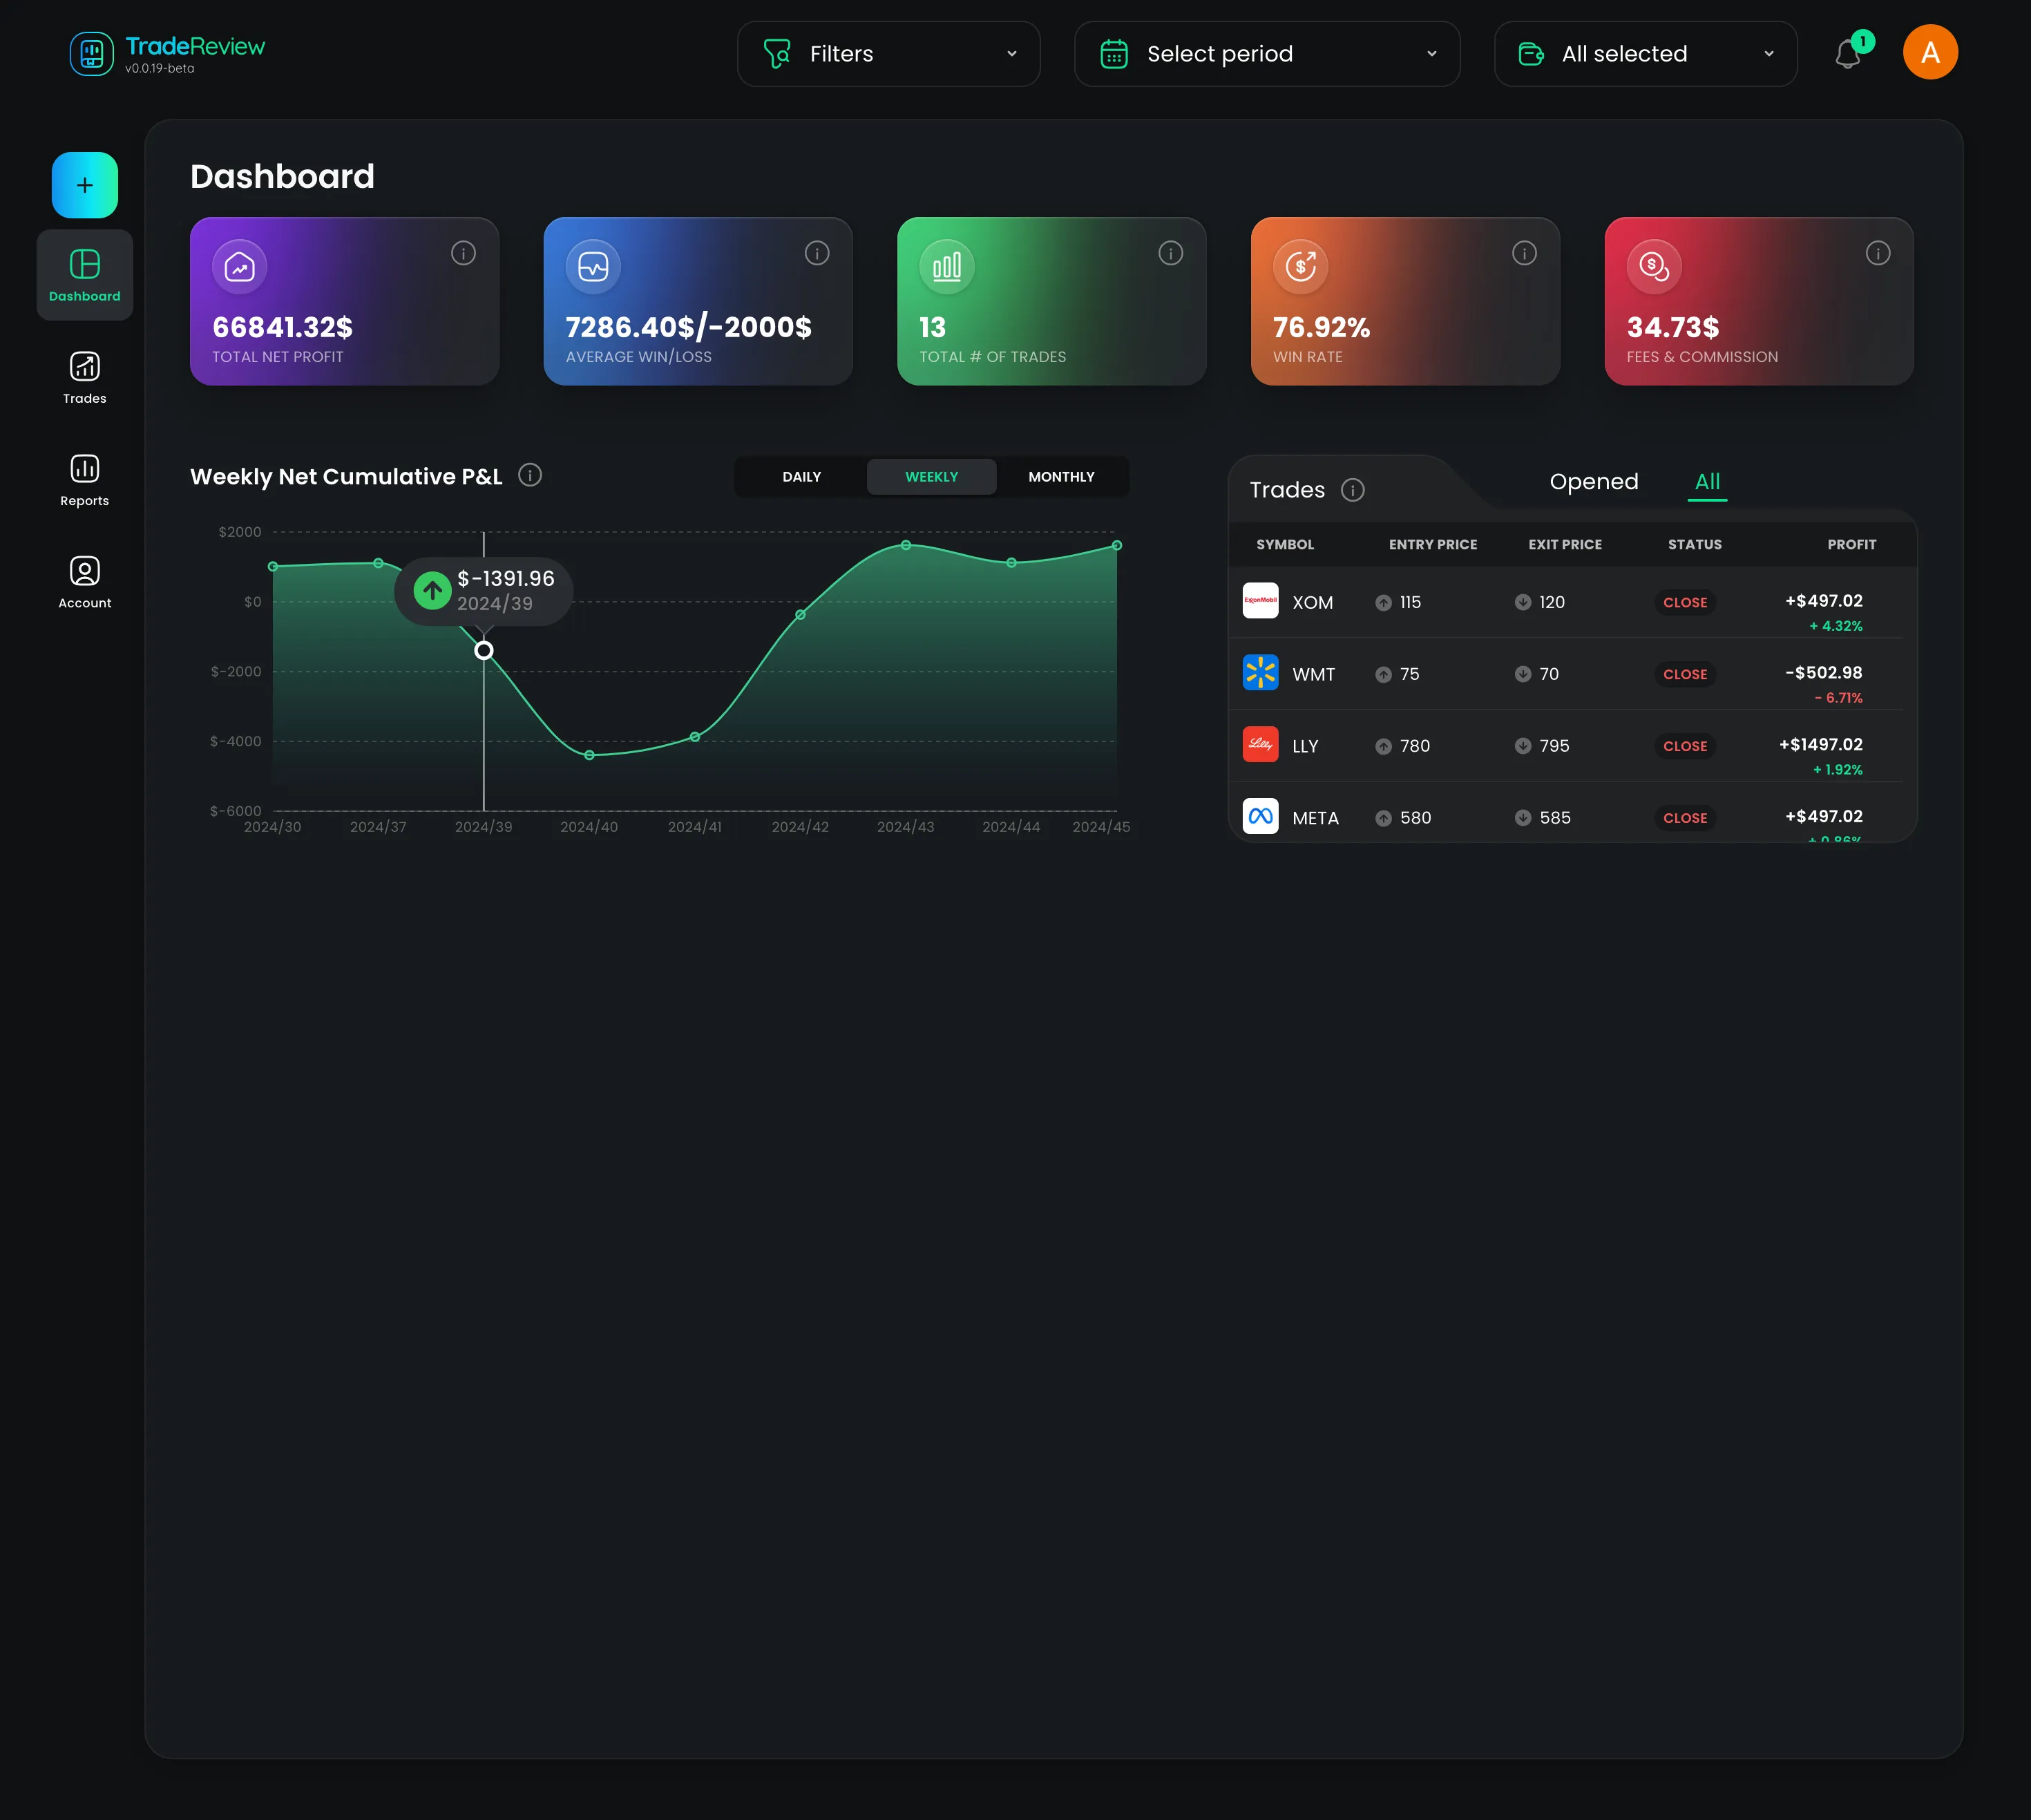
Section titled “Overview of the Dashboard”The TradeReview dashboard provides traders with a comprehensive snapshot of their performance. With key metrics, interactive charts, and a detailed trade table, the dashboard helps traders analyze their progress and refine their strategies.
Key Components of the Dashboard
Section titled “Key Components of the Dashboard”1. Performance Summary Plates
Section titled “1. Performance Summary Plates”At the top of the dashboard, you’ll find summary plates displaying essential trading statistics:
- Total Net Profit – Your cumulative profit
- Average Win/Loss – The average profit or loss per trade.
- Total Trades – The number of trades executed.
- Win Rate – The percentage of winning trades.
- Fees & Commissions – The total amount spent on trading fees.
2. Net Cumulative P&L Graph
Section titled “2. Net Cumulative P&L Graph”This interactive graph helps visualize your profitability over time. You can switch between different timeframes to get a more detailed analysis:
- Daily – View performance for each trading day.
- Weekly – Analyze trends over weekly intervals.
- Monthly – Get a broader view of long-term performance.
3. Trades Table
Section titled “3. Trades Table”The trades table provides a detailed record of all your trades, categorized into:
- All Trades – A complete list of executed trades.
- Opened Trades – Active trades that are yet to be closed.